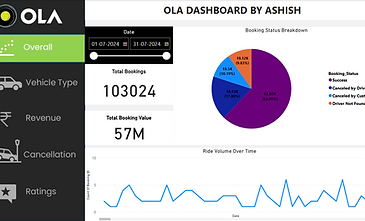
Created a Power BI dashboard to analyze ride-hailing data, revealing key insights on ride trends, customer and driver behavior, and revenue sources. Utilized advanced visualizations like time-series charts, rating comparisons, and cancellation analyses. Demonstrated strong skills in data modeling, transformation, and business-focused storytelling.

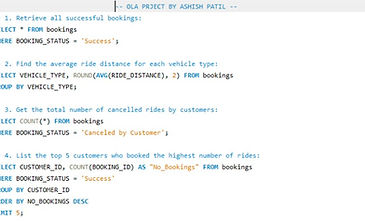
This project focuses on building an end-to-end ETL pipeline to analyze booking data from OLA, a leading ride-hailing platform. Raw ride data was extracted, cleaned, and transformed to enable efficient querying and business insight generation using SQL. Key performance indicators such as ride success rates, cancellation reasons, customer behavior, and payment methods were analyzed. The project highlights the use of SQL for operational analytics, customer segmentation, and driver performance, providing actionable insights to improve platform efficiency and user satisfaction.

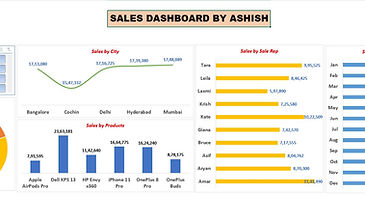
This Excel Sales Dashboard provides a dynamic overview of an electronic shop’s performance, showcasing total sales of ₹8.46 million. It features breakdowns by product, category, location, month, and salesperson, with interactive visuals and key metrics to track trends, identify top performers, and support data-driven decision-making.


